
All Remember the dot-com bubble (in Italy, were bought Tiscali, Opengate, Finmatica, E. Biscom, Fastweb, Blu, Freedomland, etc.).
What you see here is the Nasdaq Composite chart between 1994 and 2005. The 2000 peak is commonly known as the “dot-com bubble ". The bubble erupted on March 10, 2000, when the NASDAQ (main technological actions index) recorded its intraday peak at 5132.52 points before closing the session at 5,048.62, more than twice the previous year.
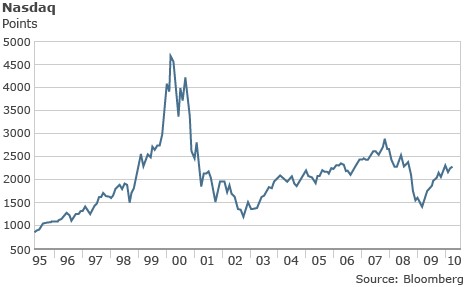
The following Monday, massive sales began, causing a chain reaction that led to a close loss of 9% in just 3 days. In 2001, many dot-com companies failed or were subject to acquisitions or mergers. Only 50% of the companies listed in 2000 remained active in 2004, with infinitesimal quotes compared to the maximums found in the full bubble.
Comparisons have often been made between this bubble and the speculative bubble in Bitcoin and the other Cryptocurrencies between late 2017 and early 2018, but there are some important differences.
In fact, compared to the Nasdaq Composite graph of those years with the Bitcoin chart between 2016 and today, we realized some clear differences, although the profile of the curve seems similar.
The first major difference is that, after the dot-com bubble burst, the Nasdaq Composite index continued to crumble, incessantly, until it returned to a pre-bubble quote (1,172,060), as expected to happen when a financial bubble is triggered. On the other hand, after the bursting of the speculative bubble at the end of 2017, the Bitcoin price ceased to fall in February 2018, and from then, it was established in a quote 6 times higher than the pre-bubble.
The second difference is that before the dot-com bubble burst, the Nasdaq Composite Index grew steadily, year after year: 4 years of growth that led from 755 to 2,505. In contrast, Bitcoin in the years prior to 2017 had remained substantially constant, from 754 dollars at the beginning of 2014 to 951 at the end of 2016.
The third is the annual increase during the bubble: The Nasdaq Composite index at 1999 increased from 2,505 to 4,696, with an increase of less than 100%. In contrast, Bitcoin at 2017 increased from 959 dollars to 14,297, an increase of nearly 1,400%.
These three differences are obvious, and therefore do not allow us to say whether speculative Bitcoin bubble of the late 2017 is actually similar to that of dot-com of 1999, except for the shape of the curve of the graph.
Not all Bitcoin growth is due to the bubble
In fact, placing them together you could even say that, while the dot-com bubble followed the classic curve of financial bubbles, which are formed and bursting back to normal, the speculative Bitcoin bubble of the late 2017 instead followed a different trend to the classic financial bubble. It was probably “just " a speculative bubble during the final period in which Bitcoin went from 1,000 to 6,000. In other words, instead of following a constant line of growth and realizing + 500% in a year, it made + 1,900% and then-70%.
Let's not forget that the beginning of the Bitcoin growth period was January 2017, and the price began to increase in May 2017. At the end of October, it reached what would later be the post-bubble quotation, the real speculative bubble is limited to the months of November and December of 2017: Remainder of the growth probably was not due to the bubble. And this could be the reason why, after the bubble burst, the price did not collapse to the pre-bubble levels, but stopped at the level of October 2017.
At this point, it is possible to imagine that the two bubbles have followed a completely different path, due to the different dynamics between them. Therefore, the dot-com bubble analysis can’t give us any significant info.
Do you want to invest in cryptocurrencies?
We offer you the weekly portfolio CryptoFIB30, in a PDF format. A portfolio of cryptocurrencies with high earning prospects, suggested by our staff (the dates and purchase prices for the reported crypotos in addition to operative signals - when to sell or keep - are indicated).
Bitcoin Future: for those who prefer, instead, to follow the derivative, Bitcoin Future is analyzed, quoted on the CME, with the indication of important levels and operative targets of purchase/sale with a weekly perspective.
Pay
Risk warnings
The views and opinions expressed are the views of Crypto Currency 10 and are subject to change based on market and other conditions. The information provided does not constitute investment advice and it should not be relied on as such. All material(s) have been obtained from sources believed to be reliable, but its accuracy is not guaranteed. There is no representation or warranty as to the current accuracy of, nor liability for, decisions based on such information.
Changes in rates of exchange may have an adverse effect on the value, price or income of an investment.
Past performance is no guarantee of future results and the value of such investments and their strategies may fall as well as rise.